Web Maps
What in the world do you want...
I mean, I got a degree in Sociology, so ...MapBrief™ Blog
How the Public Actually Uses Local Government Web MapsMetric #1 Single-Topic maps get 3 times the traffic of the traditional Map Portal
Metric #3 Auto-complete drives clean user queries
Metric #6 People Actually Interact with Balloon Content
Metric #7 People Rarely Change Default Map Settings
MapBrief™ Blog
How the Public Actually Uses Local Government Web MapsIn Denver the most common request is for “Washington Park”–a yuppie oasis where I’m forced to ponder the dark recesses of the human heart given the preponderance of couples in matching lycra.- B. Timoney
What do we want to know?
Are users able to understand the purpose of our web map and use it effectively for that purpose?
Two Methods
Usability Testing
Telemetry (gathering numbers with Google Analytics)
Examples
Seattle Parking Map
http://web6.seattle.gov/sdot/seattleparkingmap/
EPA Clean Watersheds Map
http://geoplatform1.epa.gov/cwns/
Usability Testing
the Seattle Parking Map
Audience is broader public

What we saw
- Some users had no idea they could even interact with the map
- Some users just didn't understand what they could do...
What we learned
- Totally overwhelming (for a public audience)
- Needs focus
What we did
- Add link to specific places\extents
http://web6.seattle.gov/sdot/seattleparkingmap/?xmin=1262613.83&ymin=237819.33&xmax=1275913.83&ymax=244619.33&basemap=street
- Created 'hoverable' graphics to entice users to zoom in and interact *that have since been removed…
Usability Testing Summary
- This is a luxury...
- Would be great if someone could do this for the greater good of web mapping...
Measuring Tool Usage
with EPA Web Map
Intended audience was primarily municipal water system managers BUT would ultimately be public
The Quick
The Clean Watersheds Needs Survey
Presents the results of a federally mandated survey assessing the needs, in dollars, required to adequately maintain water maintenance facilities to ensure clean water.
These results are then presented in an official Report to Congress.
CWNS Mappr
CWNS Mapper
An interactive web map supplemental to the official Report to Congress.
The Quick Guide
Clean Watersheds Web Map
Google Analytics
(function(i,s,o,g,r,a,m){
    i['GoogleAnalyticsObject']=r;
    i[r]=i[r]||function(){
        (i[r].q=i[r].q||[]).push(arguments)},i[r].l=1*new Date();
        a=s.createElement(o),m=s.getElementsByTagName(o)[0];
        a.async=1;
        a.src=g;
        m.parentNode.insertBefore(a,m)})
        (window,document,'script',
        '//www.google-analytics.com/analytics.js','ga');
ga('create', 'I M Ttly Watching U', 'auto');
ga('send', 'pageview');
How
What we want to know can be categorized and hooked up with those Events
| Event | Category | Label |
|---|---|---|
| Map click (identify) | map-interaction | map-identify |
| Facility click | map-marker-interaction | facility-popup |
| Facility detail click | get-details | facility-details |
| Search btn click | search | search-btn |
| Layer toggle item click | legend-interaction | layer-toggle |
| Geoshortcut click | geoshortcut | geoshortcut-link |
| Entity details click | get-details | entity-details |
| Facility zoom to click | zoom-to | facility-zoom-to |
| Entity zoom to click | zoom-to | entity-zoom-to |
| Basemap topo click | basemap | topo-basemap |
| Basemap satellite click | basemap | satellite-basemap |
$("#toggle-aerial-basemap").click(function () {
    // send the aerial basemap toggle event to google analytics
    ga('send', 'event', 'basemap', 'click', 'aerial-basemap');
    cwns.setBasemap("Imagery");
});
What we learned
Google Analytics Dashboard
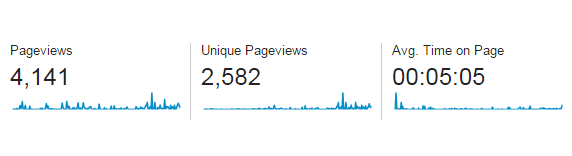
User Stats
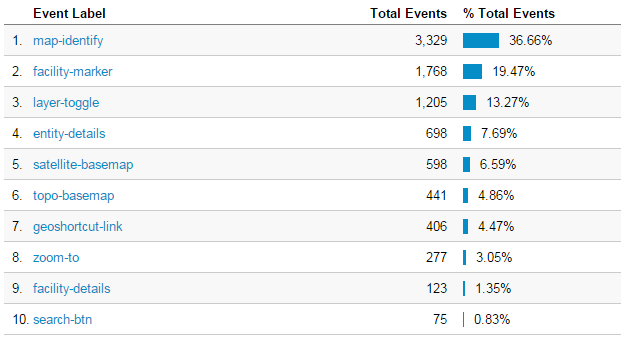
Event Labels
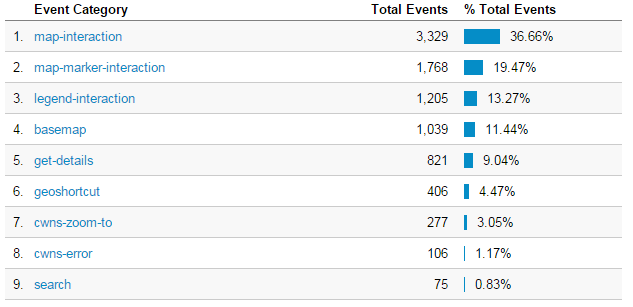
Event Categories
Event Results
- map-identify far and away the leader
- facility-marker second, but in this app, very similar to identify. Basically this is users looking for details about our Needs data, exactly what we’d hoped.
Event Results
- Basemap toggle third
This was a bit of a surprise BUT in hindsight, if you zoom in to a facility you want to see what’s on the ground or specifically where it is.
Event Results
- Geoshortcuts toward the bottom. These were concessions to the non-contigs so we didn’t anticipate high use, but they needed to be there.
Event Results
- Biggest surprise was layer toggles
Event Flow
Now if you want to get fancy
User action flow, what sequence of map interactions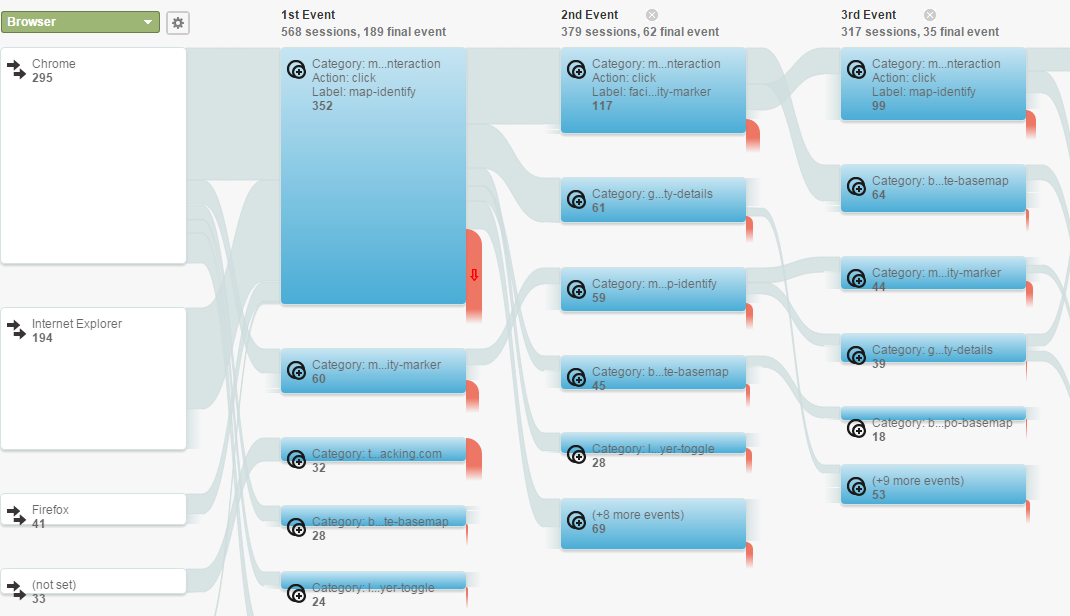
What was sad
I forgot to update google analytics after implementing auto-search
What was sad
I forgot to update google analytics after implementing auto-search
What was sad
I forgot to update google analytics after implementing auto-search
BUT...
I do know anecdotally that search is heavily requested and heavily used
and autocomplete is a no brainer
Experimental Control
What we didn’t include (but would have been interesting)
Kitchen Sink App
Select by Triangle
The Kitchen Sink always includes the ability to draw\select an (Imprecise Equilateral) Triangle.
Target your audience
Search
Don't overwhelm *unless they are 'GIS Professionals'
Give them what they need, that's it
So what's the ideal
Resources
- How the Public Actually Uses Local Government Web MapsBrian Timoney
- (Map) Telemetry: The Raw NumbersDave Bouwman
- Google Analytics Event Tracking
- Map AutocompleteDavid Puckett